Making figures and other ‘dry’ content easier to read and understand is the central focus of editorial and reporting design. Infographics have become an everyday tool, helping to make complicated content easier to understand and breaking down dense blocks of information.
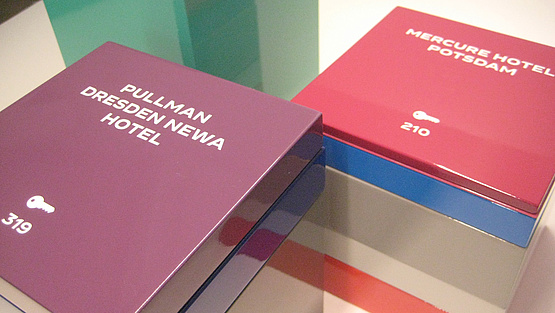
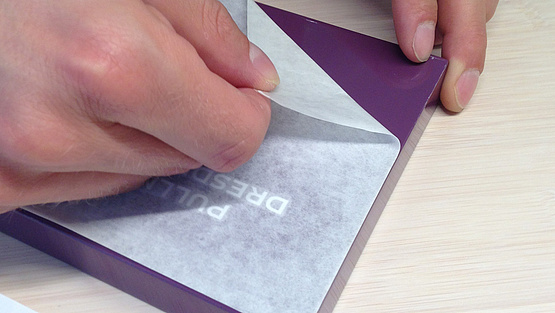
But what would it be like if you could actually touch facts and figures, which are becoming more and more abstract every day? To answer that question, we simply built a bar chart for a project. We applied a high-gloss coating and vinyl lettering to wooden and carbon cubes in precisely calculated height ratios, and the real 3D bar chart for interactive stacking, rebuilding and comparing was born.